Stock Market Bubble?
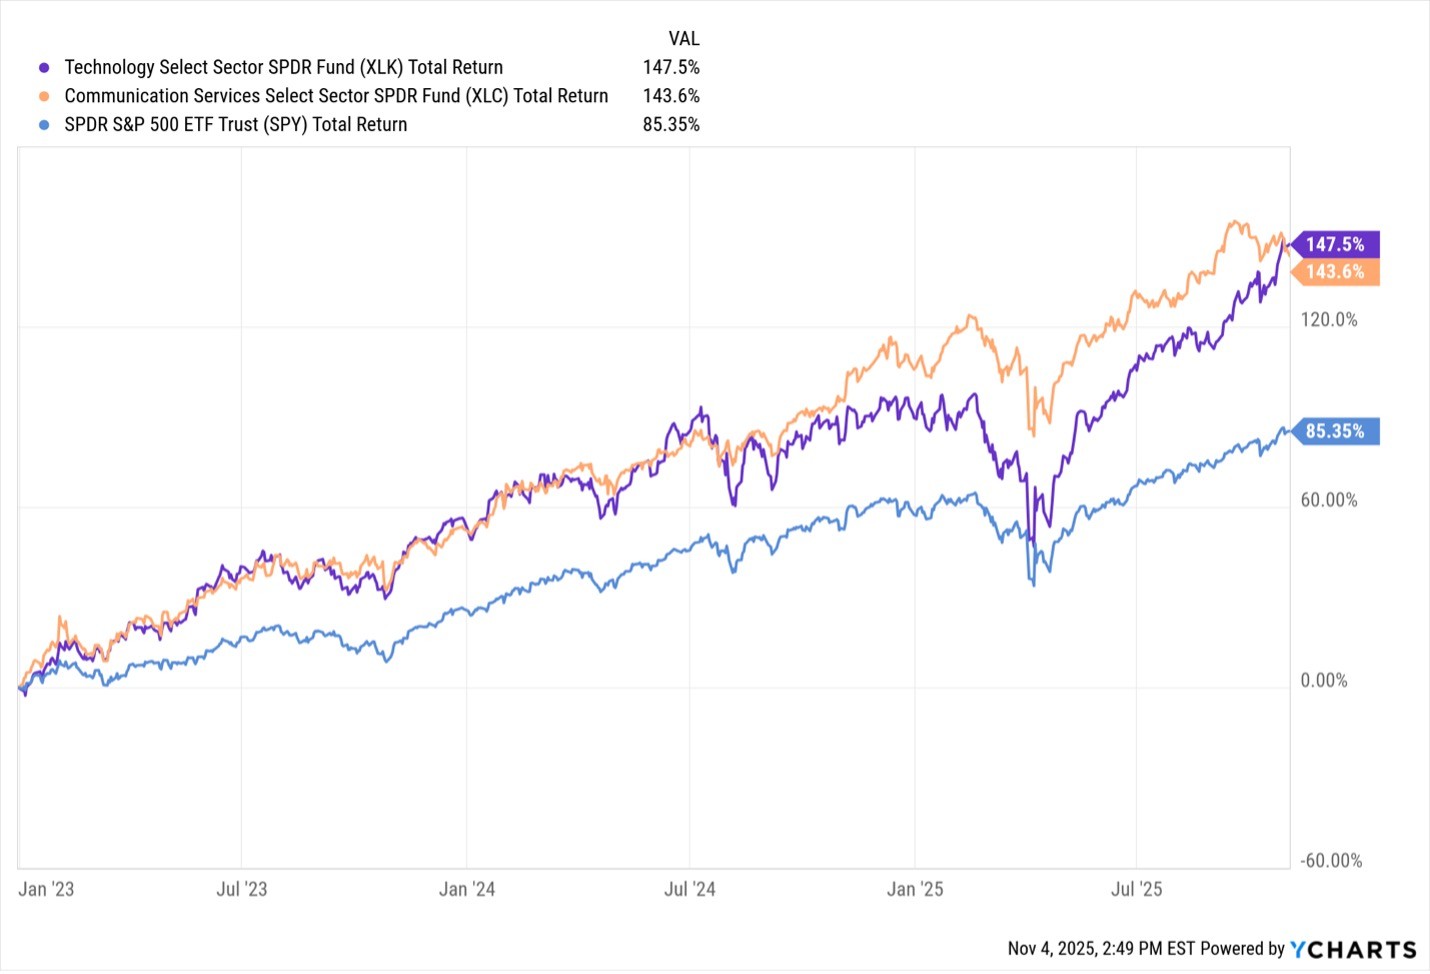
In speaking with clients recently, many are asking if we think the stock market is in a bubble. While this is a very difficult question to answer, it’s easy to understand why this question is coming up so frequently - the S&P 500 is amid its third consecutive calendar year of stellar returns (though anything could happen between now and year-end).

As you can see in the chart below, returns have been even better in technology and communication services.
Periods of great returns (even if they last several years) do not necessarily signal that a bubble has formed. Bull markets can persist for extended periods, and they don’t always end in a bubble or a melt-up. The longest bull market in history was the 11-year run we had from 2009 – 2020, which was ended by the pandemic- a completely exogenous event.
Bubbles occur when the price of stocks rises to such a level that it can’t be justified by fundamentals. Therefore, to assess whether stocks are currently in a bubble, we need to examine valuation metrics in relation to historical averages. There are a few important caveats to keep in mind here:
All else equal, valuations have been drifting higher for many years. It’s entirely possible that we are simply in a structurally higher valuation regime than we’ve seen historically.
There are several major factors that potentially support higher valuations across the board:
o Recessions have happened less frequently in recent years than they did historically.
o Corporate profit margins are substantially higher than the historical average.
o The biggest companies in the market have earnings that are growing quickly and aren’t particularly volatile.
o Interest rates have been below the long-term average for the past 25 years.
With all that in mind, let’s look at where the market stands from a valuation perspective. The chart below shows the Shiller CAPE Ratio- one of the most popular measures of market valuation. This metric compares the S&P 500’s price to the 10-year moving average of inflation-adjusted earnings. This ratio smooths out some of the short-term noise by looking at earnings over a longer period.
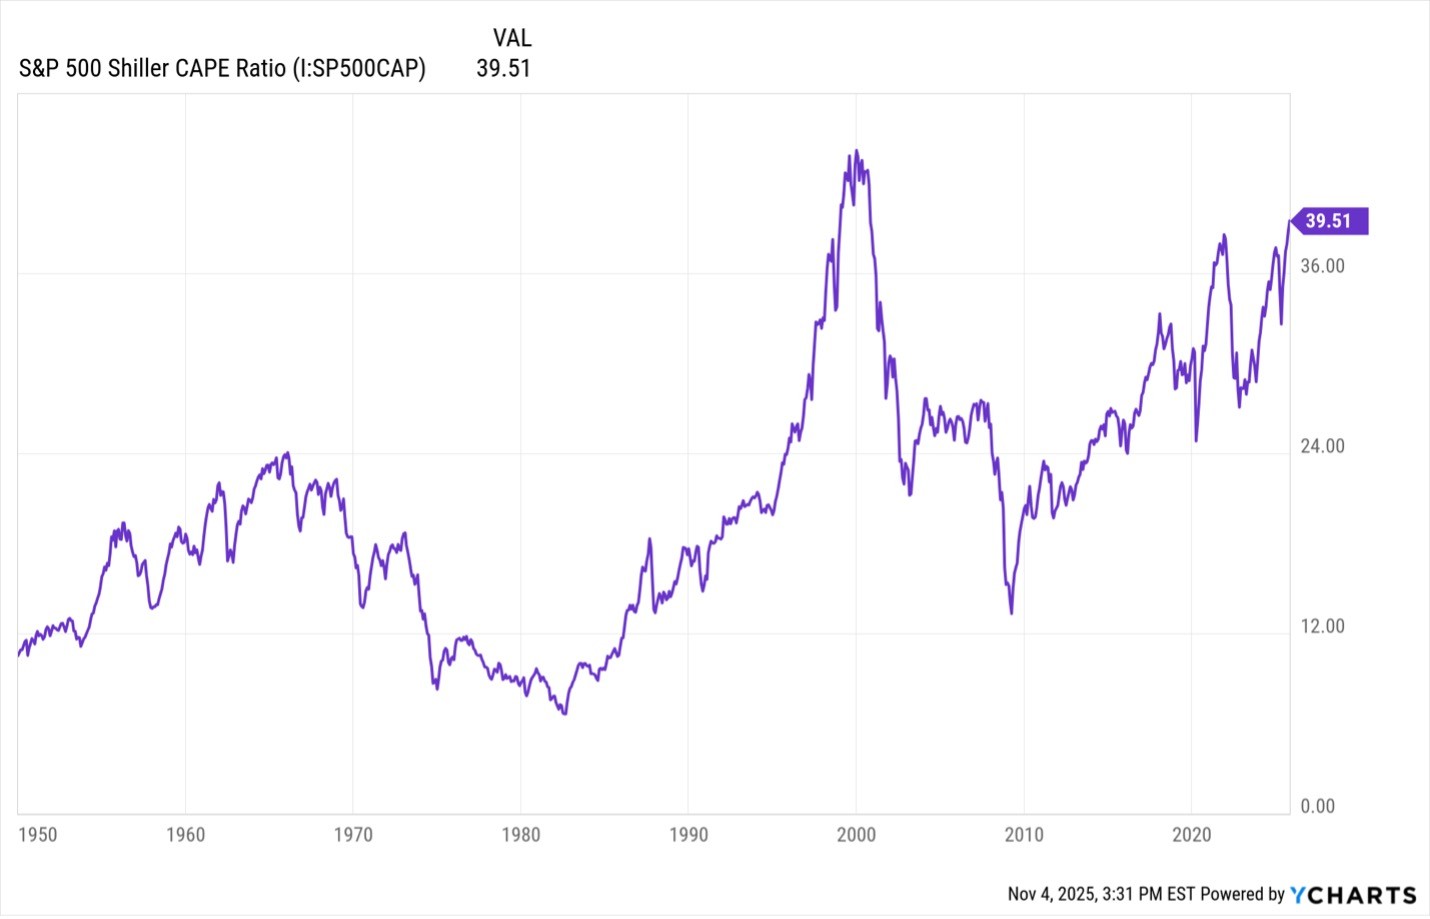
As you can see on this measure, valuations are historically high but still nearly 11% below the high in 2000.
MarketWatch published an article last week looking at a wide array of valuation ratios compared to their historical averages. The author, Mark Hulbert, found that the vast majority of these ratios are at the absolute upper end of their historical ranges.
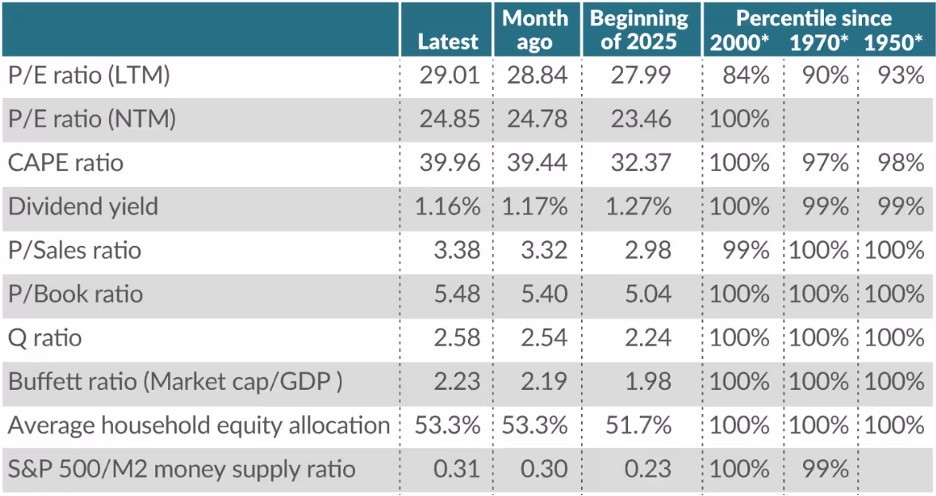
Source: MarketWatch; “The stock market is more overvalued than at almost any time in U.S. history — by virtually every measure”
It’s difficult to argue that the market is anything other than expensive on a historical basis.
However, the run-up in valuations hasn’t exactly been broad-based- the average S&P 500 stock is up just 9% since April 1st compared to a 22.5% gain for the index as a whole. Likewise, stocks that are higher quality, lower volatility, and pay a higher dividend have dramatically underperformed the market since April’s “Liberation Day” sell-off, while the most volatile stocks (High Beta) have led the way.
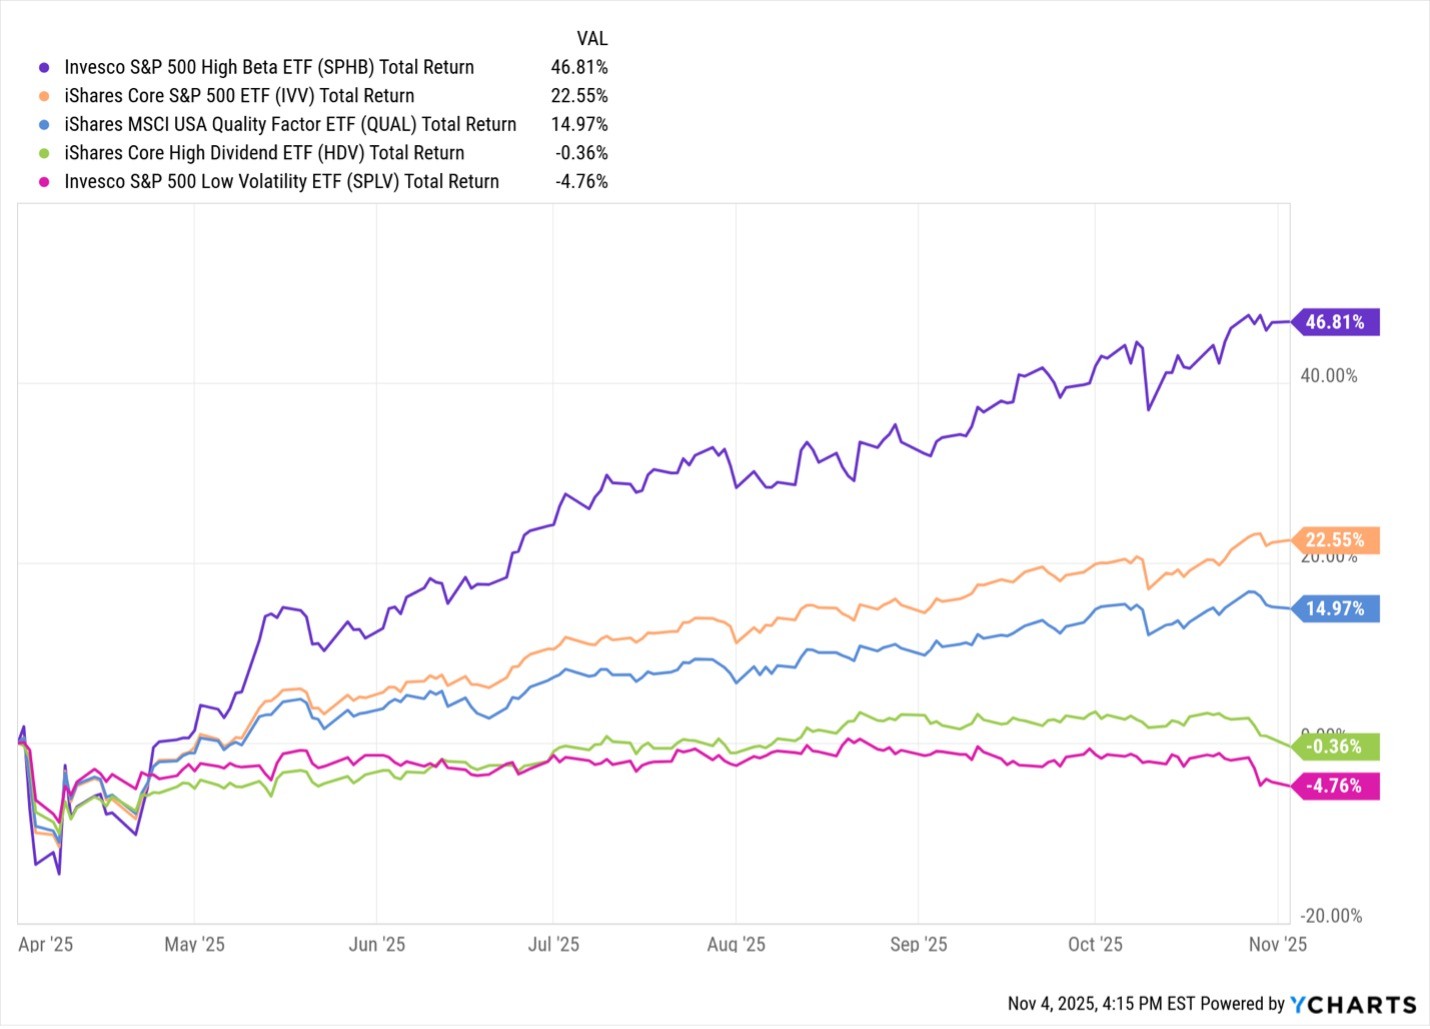
There are certainly pockets of the market that have experienced huge runups in price and valuation based on little more than speculation about the future, but there are other large swaths that haven’t participated. In these areas, we are still seeing reasonable valuations and good fundamentals.
One of the hardest parts of investing through periods of rapid share price increases and valuation runups is that the data can tell you that the market is extended, but it doesn’t indicate when valuations will come back down to earth. Using valuation as a timing mechanism simply doesn’t work.
Our investing style has long been “Growth at a Reasonable Price” which naturally places some valuation constraints on our investing decisions. We therefore tend to avoid the most richly valued areas of the market and focus instead on companies that, all else equal, are higher quality, lower volatility, and pay a dividend. These are the types of stocks that typically avoid massive swings in valuation and are less exposed to large drawdowns when valuations run too far.
Stay Informed and Confident
Get retirement insights and investment wisdom delivered straight to your inbox, no financial jargon required.


Stock Market Bubble?
In speaking with clients recently, many are asking if we think the stock market is in a bubble. While this is a very difficult question to answer, it’s easy to understand why this question is coming up so frequently - the S&P 500 is amid its third consecutive calendar year of stellar returns (though anything could happen between now and year-end).
As you can see in the chart below, returns have been even better in technology and communication services.
Periods of great returns (even if they last several years) do not necessarily signal that a bubble has formed. Bull markets can persist for extended periods, and they don’t always end in a bubble or a melt-up. The longest bull market in history was the 11-year run we had from 2009 – 2020, which was ended by the pandemic- a completely exogenous event.
Bubbles occur when the price of stocks rises to such a level that it can’t be justified by fundamentals. Therefore, to assess whether stocks are currently in a bubble, we need to examine valuation metrics in relation to historical averages. There are a few important caveats to keep in mind here:
All else equal, valuations have been drifting higher for many years. It’s entirely possible that we are simply in a structurally higher valuation regime than we’ve seen historically.
There are several major factors that potentially support higher valuations across the board:
o Recessions have happened less frequently in recent years than they did historically.
o Corporate profit margins are substantially higher than the historical average.
o The biggest companies in the market have earnings that are growing quickly and aren’t particularly volatile.
o Interest rates have been below the long-term average for the past 25 years.
With all that in mind, let’s look at where the market stands from a valuation perspective. The chart below shows the Shiller CAPE Ratio- one of the most popular measures of market valuation. This metric compares the S&P 500’s price to the 10-year moving average of inflation-adjusted earnings. This ratio smooths out some of the short-term noise by looking at earnings over a longer period.
As you can see on this measure, valuations are historically high but still nearly 11% below the high in 2000.
MarketWatch published an article last week looking at a wide array of valuation ratios compared to their historical averages. The author, Mark Hulbert, found that the vast majority of these ratios are at the absolute upper end of their historical ranges.
Source: MarketWatch; “The stock market is more overvalued than at almost any time in U.S. history — by virtually every measure”
It’s difficult to argue that the market is anything other than expensive on a historical basis.
However, the run-up in valuations hasn’t exactly been broad-based- the average S&P 500 stock is up just 9% since April 1st compared to a 22.5% gain for the index as a whole. Likewise, stocks that are higher quality, lower volatility, and pay a higher dividend have dramatically underperformed the market since April’s “Liberation Day” sell-off, while the most volatile stocks (High Beta) have led the way.
There are certainly pockets of the market that have experienced huge runups in price and valuation based on little more than speculation about the future, but there are other large swaths that haven’t participated. In these areas, we are still seeing reasonable valuations and good fundamentals.
One of the hardest parts of investing through periods of rapid share price increases and valuation runups is that the data can tell you that the market is extended, but it doesn’t indicate when valuations will come back down to earth. Using valuation as a timing mechanism simply doesn’t work.
Our investing style has long been “Growth at a Reasonable Price” which naturally places some valuation constraints on our investing decisions. We therefore tend to avoid the most richly valued areas of the market and focus instead on companies that, all else equal, are higher quality, lower volatility, and pay a dividend. These are the types of stocks that typically avoid massive swings in valuation and are less exposed to large drawdowns when valuations run too far.
Stay Informed and Confident
Get retirement insights and investment wisdom delivered straight to your inbox, no financial jargon required.
